
[Python] Graph 그리기 (Pandas)
내부적으로 matplotlib를 사용해서 동작하며, 구체적인 ploting을 하지 않는다면 Pandas의 기능만 사용해도 충분히 시각화 가능하다.
따라서 대부분의 matplotlib의 기능을 그대로 적용 가능하다. 예를 들면 그래프 선의 색, 점의 모양, label, title 등을 모두 설정 가능하다.
참고: http://shumin.co.kr/python-graph-%ea%b7%b8%eb%a6%ac%ea%b8%b0-matplotlib/
import pandas as pd
import matplotlib.pyplot as plt
import seaborn as sns
import numpy as np
db1 = pd.read_csv("./data/cars.txt")
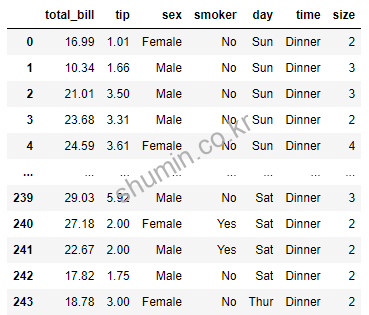
db2 = pd.read_csv("./data/customers.txt", dtype={"sex":"category", "day":"category"})
print(db2)
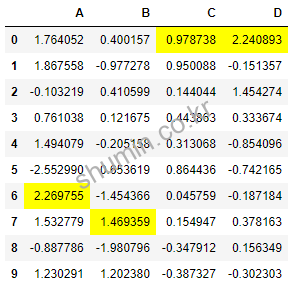
Built-in Styles
Pandas를 사용하면 table을 통해 데이터를 분석하게 되는데, 표를 시각화하기 위해서 미리 만들어 놓은 style을 활용 할 수 있다.
해당 기능은 Jupyter에서 표현이 가능하며, terminal에선 되지 않는 것으로 확인됐다.
참고 사이트: https://pandas.pydata.org/pandas-docs/stable/user_guide/style.html#Builtin-Styles
import pandas as pd
import matplotlib.pyplot as plt
import seaborn as sns
import numpy as np

np.random.seed(0)
df = pd.DataFrame(np.random.randn(10,4), columns=['A','B','C','D'])

# Builtin Styles
df.style.highlight_max(axis=0) # 각 열에서 최대값을 하이라이트한다.
DataFrame to Excel
DataFrame을 excel로 저장하고 싶을 때 사용하는 기능이다.
import pandas as pd
import numpy as np
import os

np.random.seed(0)
df = pd.DataFrame(np.random.randn(10, 4), columns=["A", "B", "C", "D"])

base_dir = "./"
file_nm = "df.xlsx"
xlxs_dir = os.path.join(base_dir, file_nm)

df.to_excel(xlxs_dir, # directory and file name to write
            sheet_name = 'Sheet1',
            na_rep = 'NaN',
            float_format = "%.2f",
            header = True,
            #columns = ["group", "value_1", "value_2"], # if header is False
            index = True,
            index_label = "id",
            startrow = 1,
            startcol = 1,
            #engine = 'xlsxwriter',
            freeze_panes = (2, 0)
            )
위 코드를 수행하면 xlxs 파일이 생성되는 것을 확인 할 수 있다.
추가로 두 개 이상의 DataFrame을 사용할 때 overwrite 되는 부분을 주의해야한다. 만약 이런 상황에선 아래 코드를 활용하면 된다.
import pandas as pd
import numpy as np
import os

np.random.seed(0)
df = pd.DataFrame(np.random.randn(10, 4), columns=["A", "B", "C", "D"])
df1 = pd.DataFrame(np.random.randn(10, 4), columns=["E", "F", "G", "H"])

base_dir = "./"
file_nm = "df.xlsx"
xlxs_dir = os.path.join(base_dir, file_nm)

with pd.ExcelWriter(xlxs_dir) as writer:
    df.to_excel(writer, sheet_name="DF_1")
    df1.to_excel(writer, sheet_name="DF_2")
위 코드를 수행하고 나면 서로 다른 excel tab에 값이 저장된다.
참고로 해당 기능을 수행하기 위해선 excel 파일이 열려있으면 안된다.